
The Fundamental Diagram:
Basis of congestion assessment
Whenever we talk about assessing congestion situations, the term Fundamental Diagram comes up. But what exactly is a Fundamental Diagram? Why is it always referred to, and what does it mean in terms of simulations? This article answers these questions and more.
The origins of the Fundamental Diagram
The Fundamental Diagram originated in traffic engineering and visualizes the state equation of traffic flow:
Q = D * V
Q is the traffic flow, D is the traffic density, and V is the speed. It therefore describes the state of a traffic system. This state can range from free-flowing traffic to congested traffic to traffic jams.
This state equation was derived from empirical data and therefore every traffic system is subject to this relationship. Today it serves as an important basis for the design of traffic facilities or traffic management systems.
What significance does the Fundamental Diagram have
The Fundamental Diagram describes the different phases of traffic - simply put, free-flowing traffic, congested traffic, and traffic jams.
The diagram can therefore be used to describe the traffic situation as a function of the number of road users and the available capacity. For example, if a new highway feeder road is planned, this correlation is useful: this information can be used, for example, to check the flow between each traffic light phase to the feeder road to ensure that there is no congestion.
The diagram can therefore be used to describe the traffic situation as a function of the number of road users and the available capacity. For example, if a new highway feeder road is planned, this correlation is useful: this information can be used, for example, to check the flow between each traffic light phase to the feeder road to ensure that there is no congestion.
How does the Fundamental Diagram work for crowd simulation?
However, congestion is not only caused by vehicles; the relationship between pedestrian flow, density, and speed can also be established for pedestrian traffic. For example, [Weidmann] has collected data on pedestrian traffic around the world and created a Fundamental Diagram.
When looking at pedestrian traffic, there are also three phases: free flow, restricted flow, and congestion. Especially in evacuation situations, you want to avoid congestion, so regulations such as the MBO in its implementation or the MVstättVO specify permissible numbers of people for exit widths.
When looking at pedestrian traffic, there are also three phases: free flow, restricted flow, and congestion. Especially in evacuation situations, you want to avoid congestion, so regulations such as the MBO in its implementation or the MVstättVO specify permissible numbers of people for exit widths.
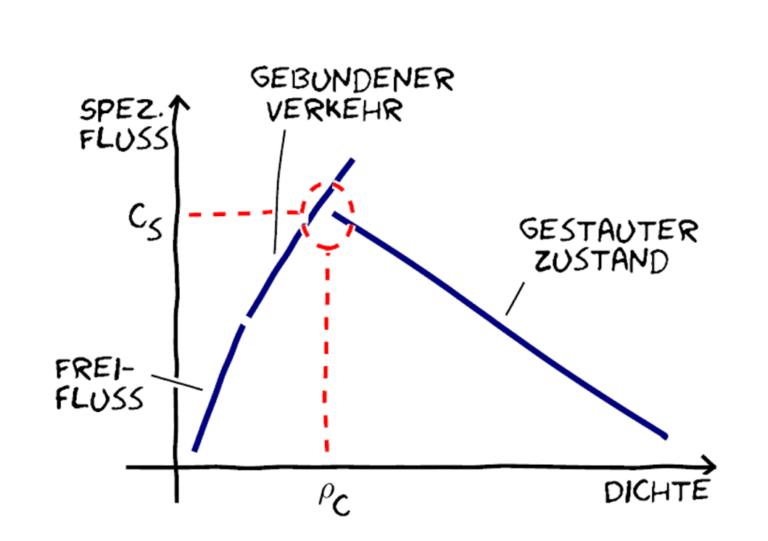
From: Holl, Stefan: "Methoden für die Bemessung der leistungsfähigkeit multidirektional genutzter Fußverkehrsanlagen", Dissertation 2016.
Here you can see that the flow of people (in this case the specific flow, which indicates people per meter per second) initially increases as a function of the density of people until it reaches a maximum - at which point the optimum capacity is reached. If this point is exceeded, the system enters a state of congestion.
Very different experiments and empirical data have been used to derive the Fundamental Diagram for pedestrians. This resulted in very different basic diagrams: Depending on the type of population (young, old, mixed), culture (e.g. European, Asian, etc.), occasion (event, leisure traffic, commuter traffic), type of traffic system (unidirectional, bidirectional), very different diagrams result, as visualized in the figure below by [Meunders]:
Very different experiments and empirical data have been used to derive the Fundamental Diagram for pedestrians. This resulted in very different basic diagrams: Depending on the type of population (young, old, mixed), culture (e.g. European, Asian, etc.), occasion (event, leisure traffic, commuter traffic), type of traffic system (unidirectional, bidirectional), very different diagrams result, as visualized in the figure below by [Meunders]:
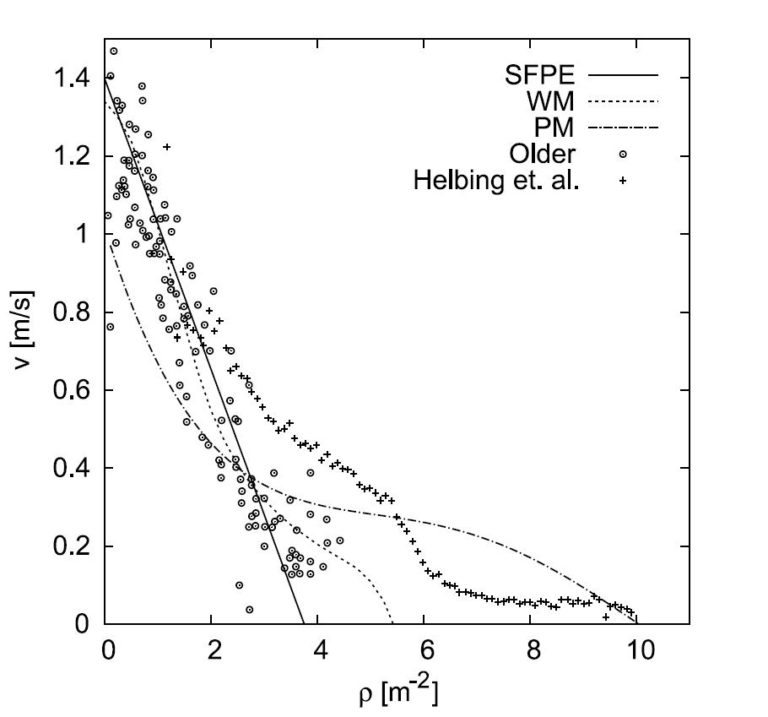
Density dependence of velocity From: Meunders, Andreas: "Kalibrierung eines mikroskopischen Modells für Personenströme zur Anwendung im Projekt Hermes". Master's thesis, 2011.
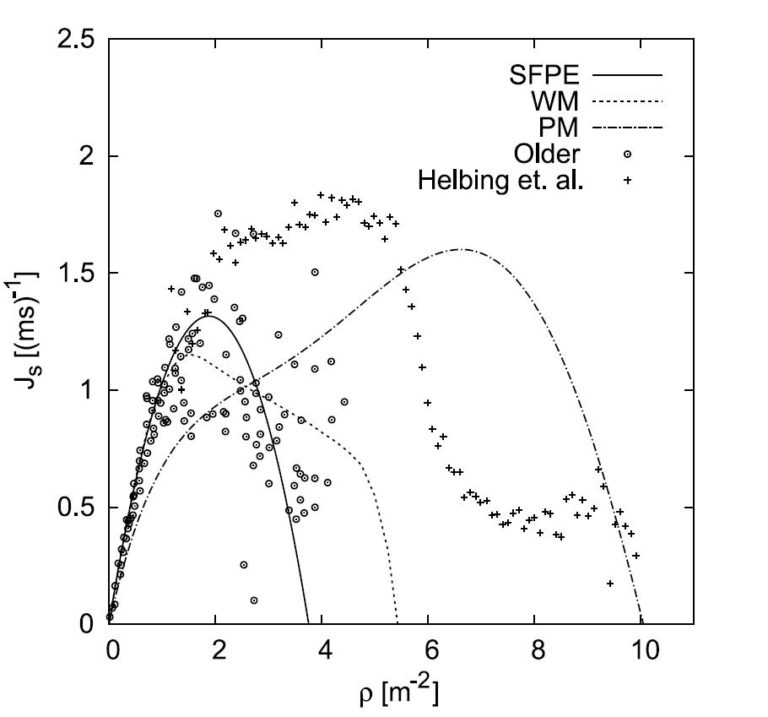
Density dependence of the specific flow From: Meunders, Andreas: "Kalibrierung eines mikroskopischen Modells für Personenströme zur Anwendung im Projekt Hermes". Master's thesis, 2011.
There is therefore not just one Fundamental Diagram, but a multitude of diagrams with different characteristics; however, they all have the same characteristic properties: The flow initially increases up to a maximum (capacity limit) and then becomes congested.
What is the significance of the Fundamental Diagrams in a simulation?
Fundamental Diagrams serve as input for macroscopic pedestrian flow analysis. For example, as shown in the figure above, Predtetschenski and Milinski derived several Fundamental Diagrams from experiments, depending on the occasion and clothing. These diagrams are then used to determine the flow of people and ultimately to calculate evacuation times.
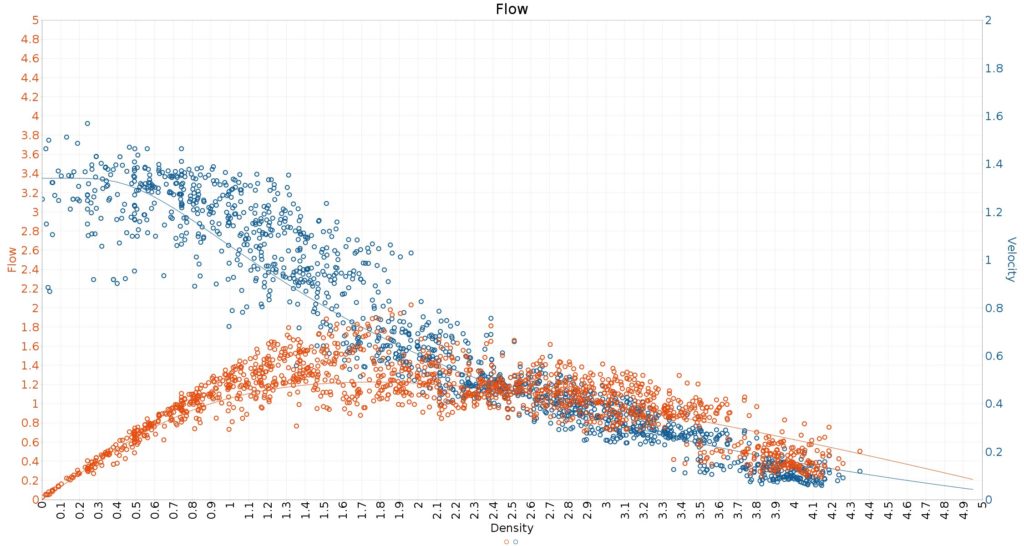
The situation is completely different for microscopic models: There, the Fundamental Diagram is used not as an input variable, but as an output variable. Microscopic models are first calibrated using these diagrams to determine the values for modeling each person. Once a model has been calibrated to a graph, the Fundamental Diagram is generally used to validate the model. In German-speaking countries, the Weidmann Fundamental Diagram has become established and is used for validation.
The RiMEA test 4 [RiMEA] also aims at this validation. The microscopic model is simulated in a long straight corridor and a Fundamental Diagram is derived. The simulation results should show the fundamental diagram as a function of the input variables.
How are the microscopic models calibrated to produce accurate results?
Input values for microscopic simulations are speed distributions of the agents, space requirements, etc. Depending on the selected values, the corresponding Fundamental Diagram is generated.
This is not possible otherwise: because the Fundamental Diagram considers aggregated values such as people flow and density, these values cannot be used as input for microscopic models. Instead, these values can be displayed as aggregated results of the simulation. This makes sense: people flow simulations are used in complex projects where such an answer is needed to assess the safety situation.
This is not possible otherwise: because the Fundamental Diagram considers aggregated values such as people flow and density, these values cannot be used as input for microscopic models. Instead, these values can be displayed as aggregated results of the simulation. This makes sense: people flow simulations are used in complex projects where such an answer is needed to assess the safety situation.
Example of software calibration on the Fundamental Diagram in crowd:it
Caution should be exercised when microscopic models use Fundamental Diagrams as input parameters: These models are not true microscopic models; rather, they mimic the Fundamental Diagram and then slow down agents as a function of density to hit the values of the Fundamental Diagram. At their core, therefore, they are macroscopic models that solve on an agent basis. Such an approach can distort the results and thus falsify the evaluation of the congestion situation.
Literature:
Holl, Stefan: Methoden für die Bemessung der Leistungsfähigkeit multidirektional genutzter Fußverkehrsanlagen, Dissertation 2016
Meunders, Andreas: "Kalibrierung eines mikroskopischen Modells für Personenströme zur Anwendung im Projekt Hermes", Master Thesis 2011.
RiMEA Richtlinie für Mikroskopische Entfluchtungsanalysen, Version 3.0, 10. März 2016,
http://www.rimea.de/fileadmin/files/dok/richtlinien/RiMEA_Richtlinie_3.0.0_-_D-E.pdf
Weidmann, U. (1993): Transporttechnik der Fussgänger: Transporttechnische Eigenschaften des Fussgängerverkehrs (Literaturauswertung)