Evaluations in crowd:it
crowd:it offers a variety of evaluations for the analysis of crowd simulations. Here is an overview of the areas that can be analyzed and the conclusions that can be drawn.

How can I create reports?
A listing of different evaluation tools and their purpose can be found here.
Which areas can be evaluated?
- The entire scenario
- A specific level
- One simulation object
- One counting line or across several counting lines
- Specific areas via evaluation rectangles
Which diagrams are available in crowd:it?

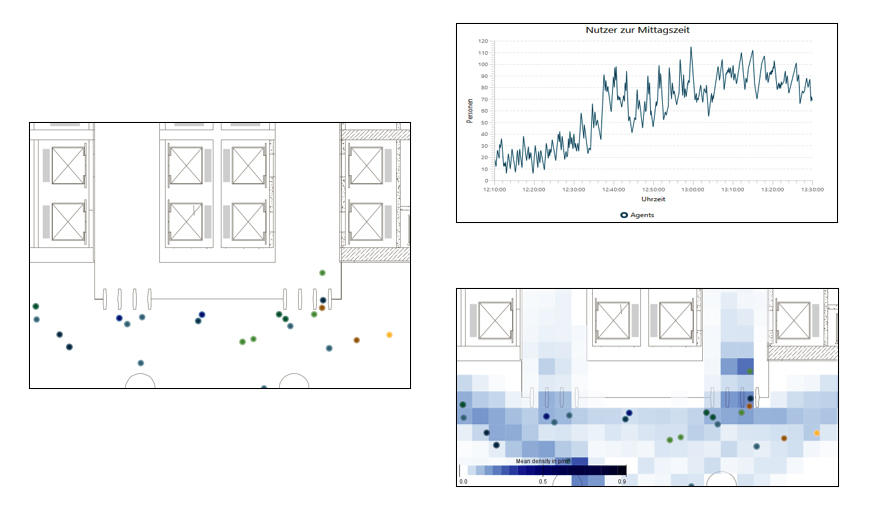
Line chart
- graphical representation of the correlation of two characteristics
- shows the development of these parameters
- examples: evacuation time, number of people per floor or in the building, maximum density over time
Scatter plot
- graphical representation of pairs of values of two statistical characteristics
- shows strength and direction of a correlation
- examples: Lengths of stay of individual agents, individual velocities, local densities


Related links
- Typical questions of simulations and how they can be answered
> read more - Congestion analyses
> more