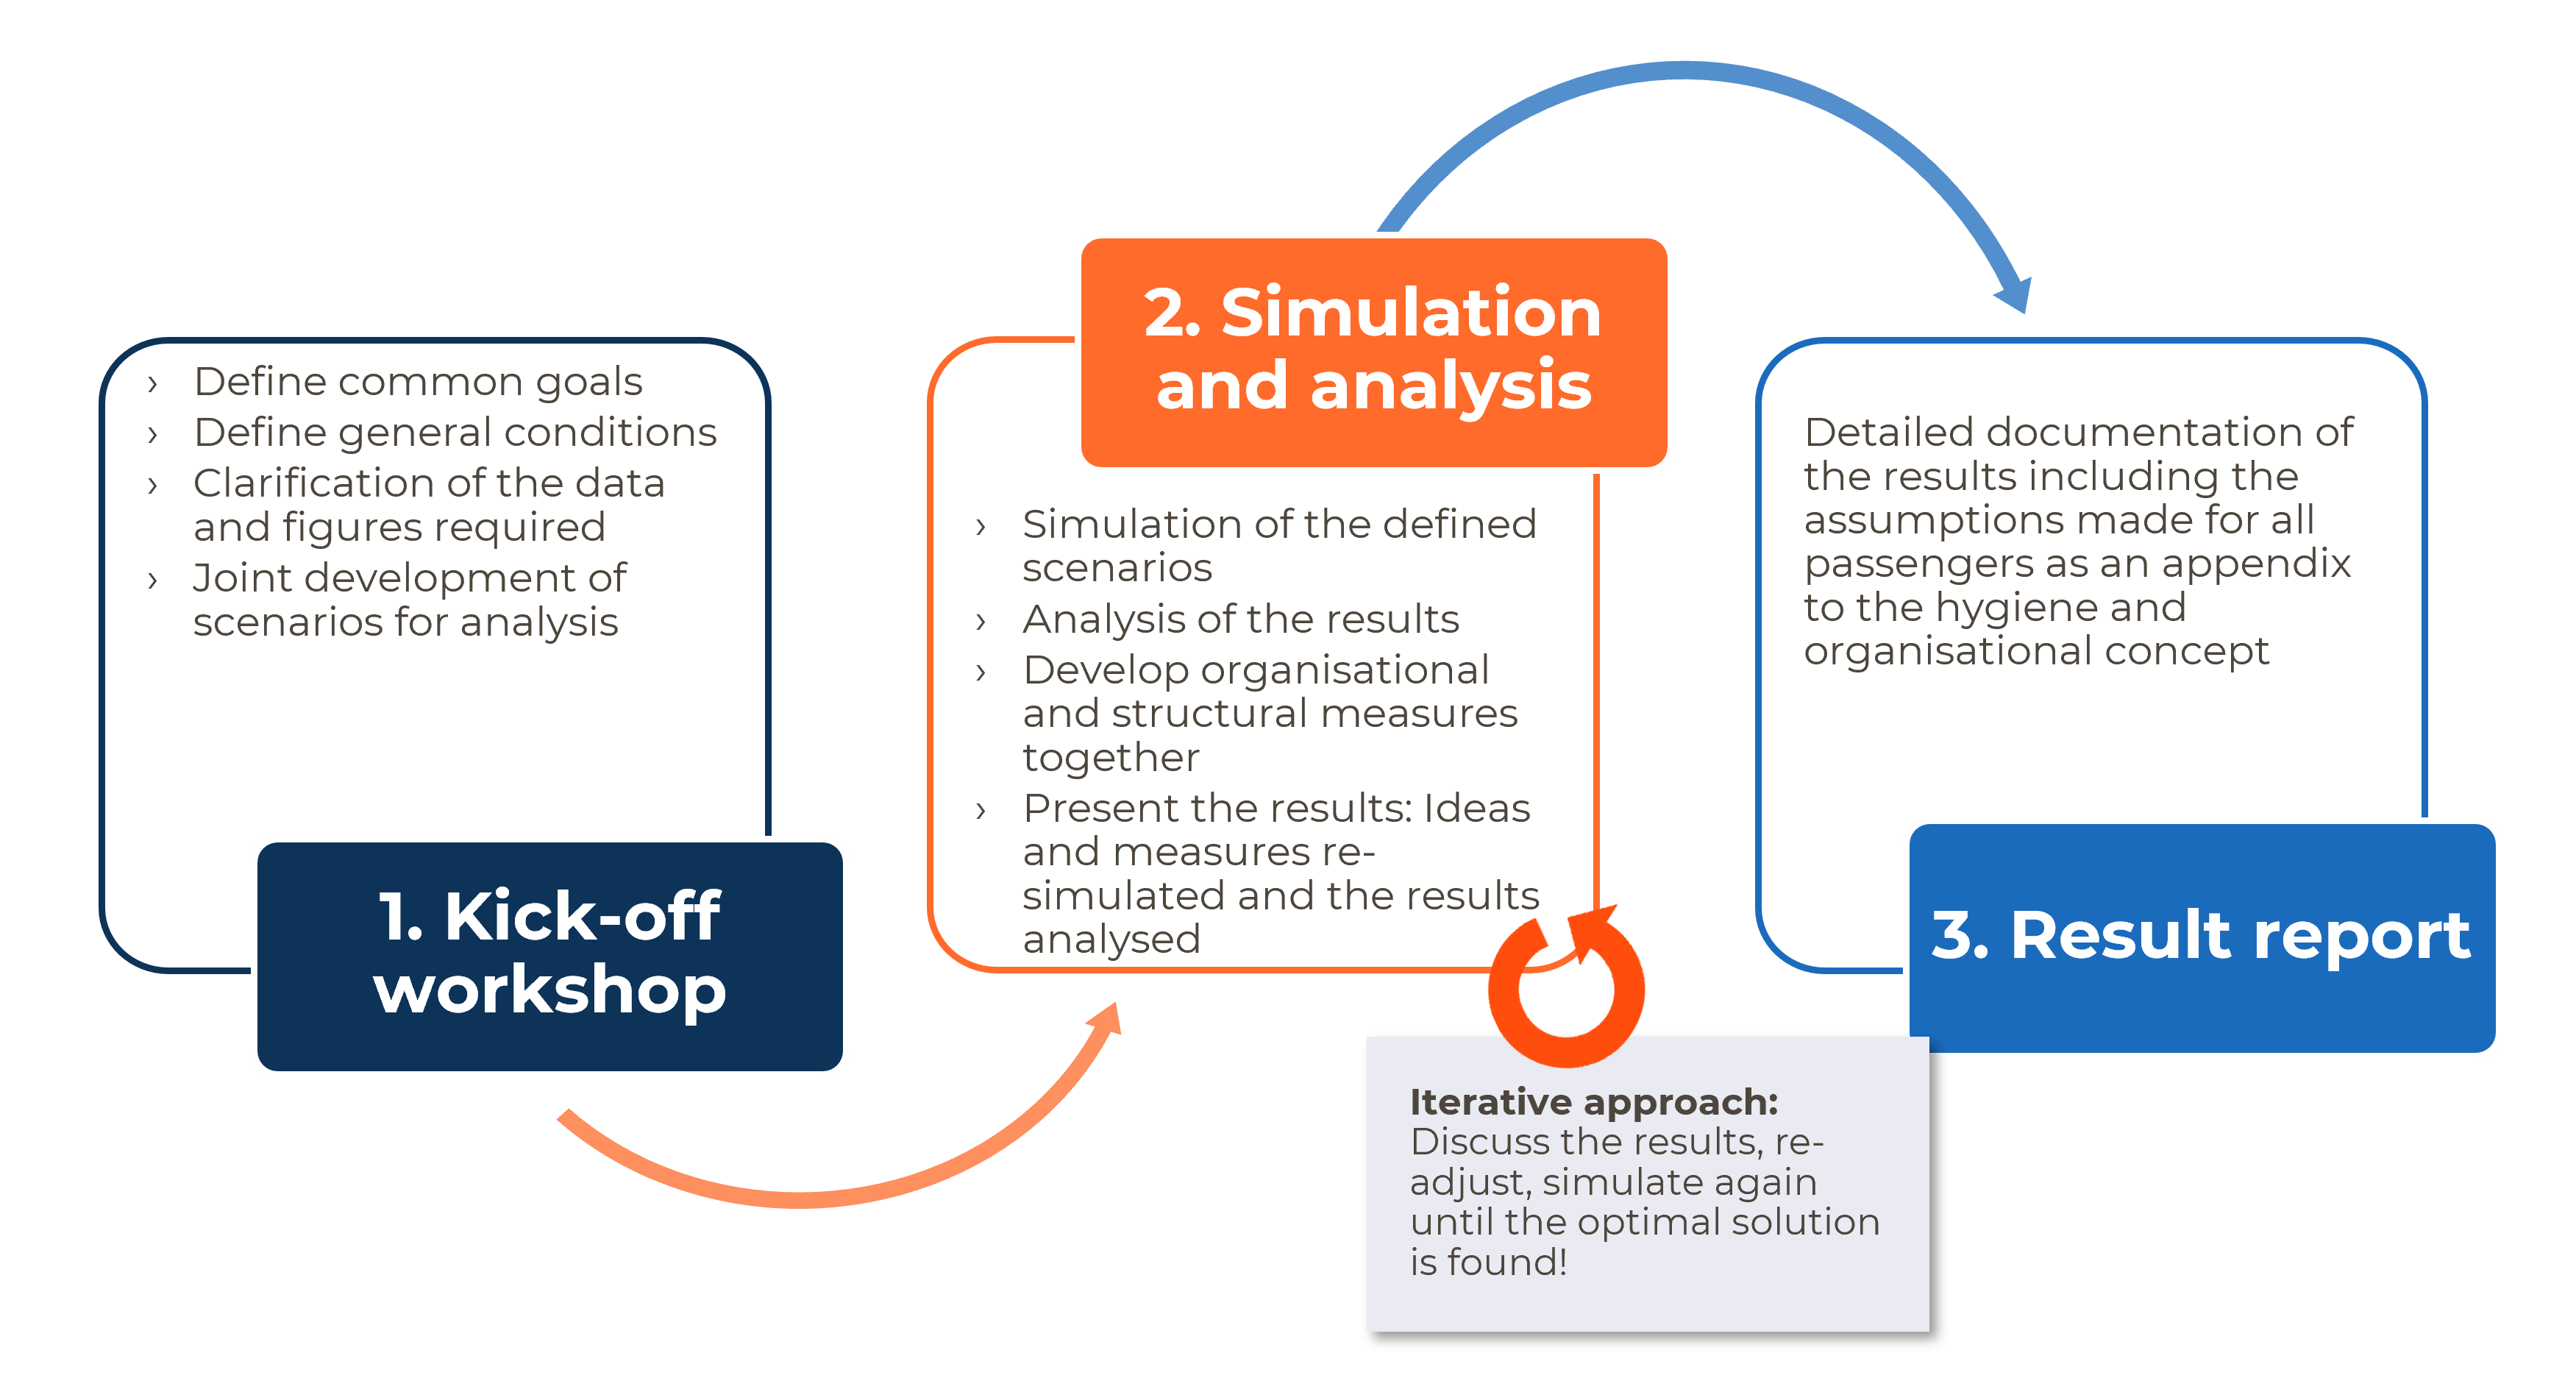
Our iterative approach orients towards customer needs

What do you get from it?

We summarize all results that are relevant for your project in a comprehensive result report. This includes the scenario description, the input parameters, simulation results as well as the resulting evaluations in relation to your simulation objective. The report can then be used as a supplement for authorities and inspectors or as a design aid for architects and planners.
Tangible evaluations
to document the results
Videos
Videos show the spatio-temporal sequence of simulation results and contribute to a better understanding of the crowd dynamics.


Heatmaps
Heatmaps enrich spatial plans with information through color coding. This facilitates the analysis of the results, as a specific aspect is highlighted and can be vividly displayed. This representation makes it possible to see at a glance where potential bottlenecks occur on the floor or where neuralgic points form. They also show potentials, e.g. unused space.
Traces
By displaying the walking routes of pedestrians, the area utilization is recognizable at a glance. Pathways are visible and can be used for further evaluations such as travel times or waiting or service times.


Detailed analysis
Detailed analysis help to analyze the results precisely for specific aspects and to generate automated charts from those. These are perfect for quantitatively underpinning the simulation results and attaching them to a report.